I can’t stop researching the student debt crisis and I need a statistics degree, send help.
Look I’m a nerd but not actually an expert in advanced mathematics, so as the variables pile up, so does my desire for econometrics training. In preparation for my next class on Hacking Debt, I’ve been crunching into the open data on student loans and, well – it’s complex to answer the question:
Why are student loans going up SO MUCH faster than the rate of tuition and student borrowers would suggest?

As I crunch numbers, here’s some research other, trained statiticians have done.
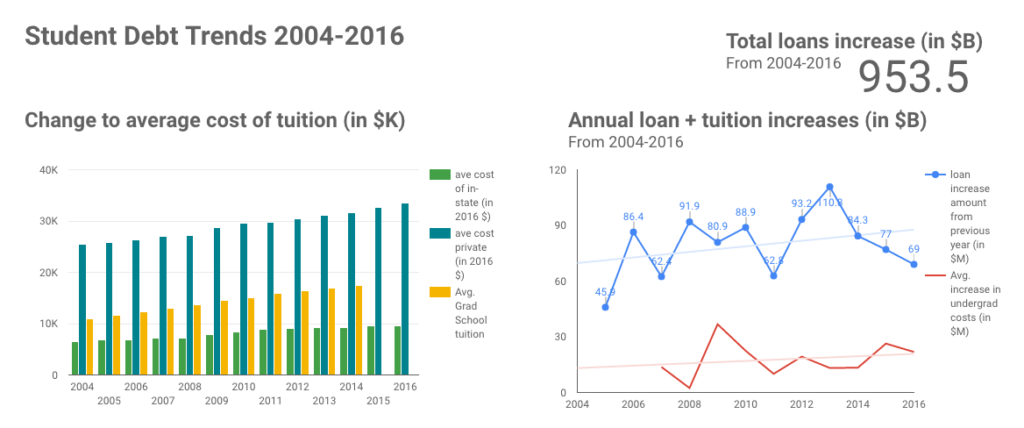
1. Over 2007-2016, the cost to go to college is rising, on average 3.5% a year faster than inflation (source). The number of students taking out loans, increasing an average of 4.6% a year.
2. The Consumer Federation of America released a report in March 2017, on default rates. Along with shouting out the lawsuit against Navient, they point out:
As of the 2016 data released, “Average amount owed is $30,650 per federal student loan borrower. Average amount owed per borrower continues to tick up, rising 17% since the end of 2013, when borrowers owed on average of $26,300.”
3. Other sources pin debt levels even higher, “the average Class of 2016 graduate has $37,172 in student loan debt, up 6% from last year.”
4. As of 2013, “Overall, average net tuition has therefore increased only 13 percent over the last ten years—far below the 77 percent increase in student debt… In 2000, the average student borrowed only 38 percent (or about $3,600 annually) to finance their tuition…now the average borrow covers 50%.” (source).
5. From 2004-2016, the number of borrowers has increased 49.8%, from 28.3 to 41.4 million people. However, the amount of loans has increased 275%, from 346.2 to 1299.7 billion dollars, according to the Federal Student Aid report (source).